
WTI crude oil is currently trading around $61.31 per barrel, caught within a well-defined consolidation pattern that has been developing over the past several weeks.
The commodity appears to be forming a descending triangle, with converging trend lines creating a narrowing trading range between approximately $64.00 resistance and $56.25 support.

The price action shows crude oil testing the upper boundary of this triangle formation, with the descending red trend line acting as dynamic resistance. Meanwhile, the short-term support at $60 per barrel from the May lows continues to provide support, suggesting buyers remain active on dips toward lower levels.
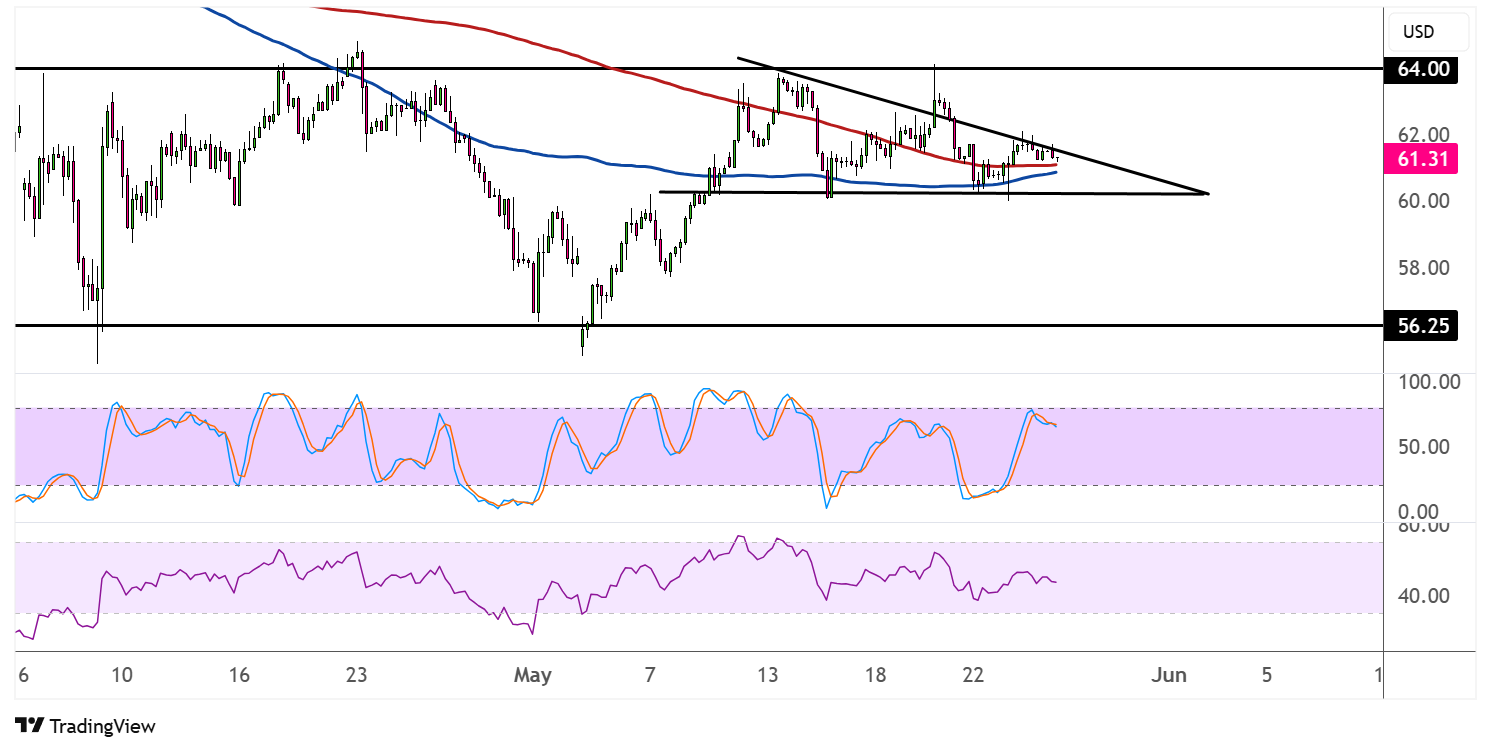
From a moving average perspective, the 100 SMA (red line) and 200 SMA (blue line) are converging, indicating a potential shift in momentum. The narrowing gap between these key indicators suggests that a decisive breakout from the current consolidation could be imminent, with the direction of the break likely determining the next significant move.
The triangle pattern typically suggests a continuation of the prior trend, though in this case, the sideways action makes direction less clear. A break above $64.00 could target higher levels toward $66-67 per barrel, while a breakdown below $56.25 support might open the door for a test of deeper support levels.
Technical indicators present a neutral to slightly bullish picture. The Stochastic oscillator is hovering in the middle range, suggesting neither overbought nor oversold conditions, which aligns with the consolidative price action. The RSI is similarly positioned in neutral territory around the 50 level, indicating balanced momentum between buyers and sellers.
WTI crude oil continues to be influenced by geopolitical tensions in key oil-producing regions and global demand dynamics. The narrowing triangle pattern suggests a significant breakout is approaching, with traders likely positioning for the next directional move. Volume expansion on any breakout would provide additional confirmation of the chosen direction.