
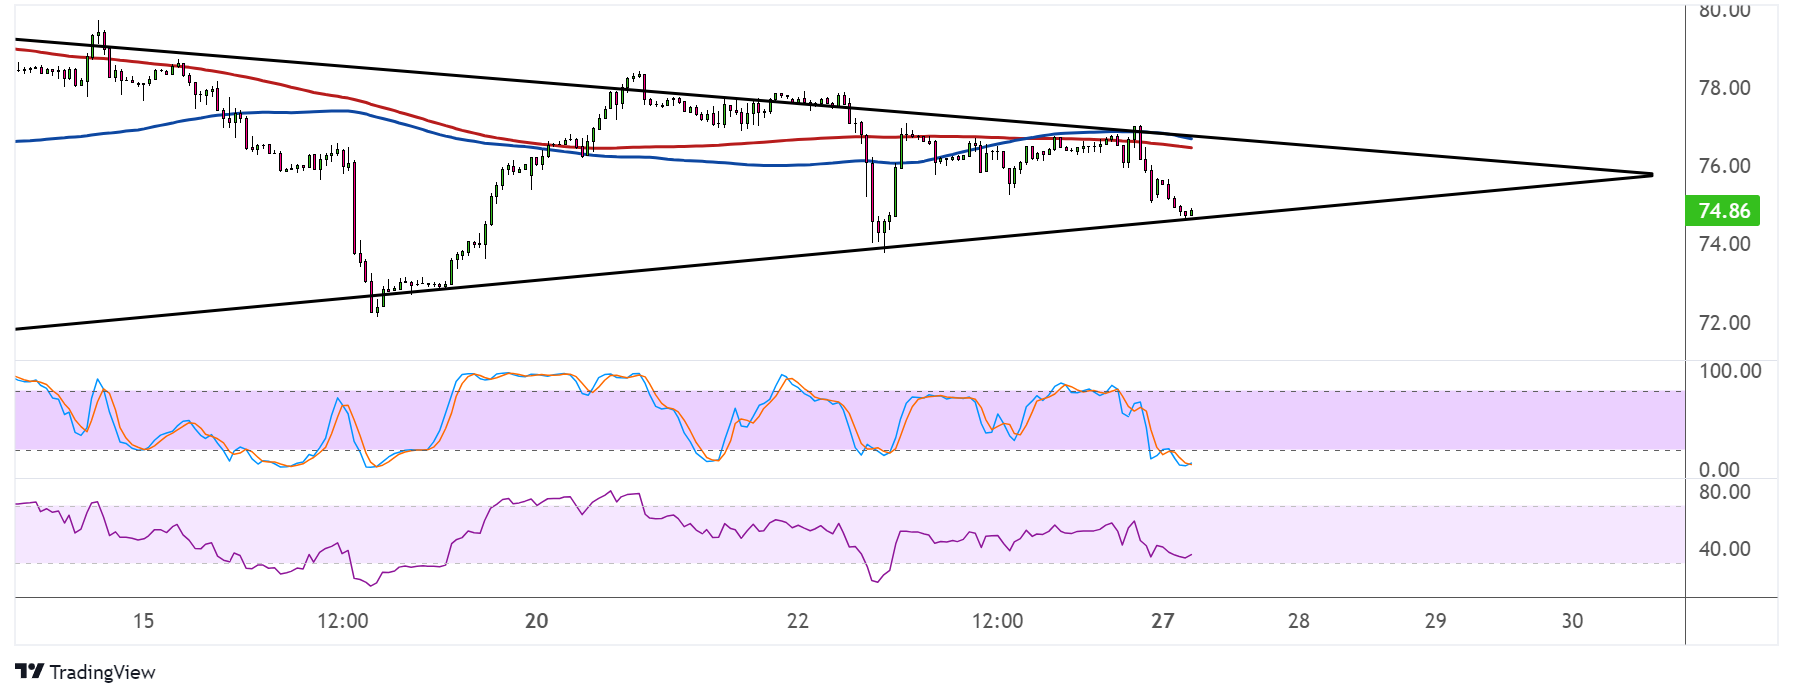
WTI crude oil has formed lower highs and higher lows to consolidate inside a symmetrical triangle pattern. Price is down to support and might be in for a bounce to resistance again.
The 100 SMA is above the 200 SMA to suggest that the path of least resistance is to the upside or that support is more likely to hold than to break. These moving averages coincide with the triangle top around $77 per barrel to add to its strength as a ceiling.

Stochastic is dipping into the oversold region to reflect exhaustion among sellers, so buyers might take over as the oscillator heads back up. Similarly RSI seems to be bottoming out, so a return in bullish momentum might follow.
Still, a break below the triangle bottom could be followed by a selloff that’s the same height as the chart formation. Similarly a break above the triangle top could spur a rally that’s the same size as the triangle, which spans around $72 per barrel to $78 per barrel.
WTI crude oil might take cues from inventory data by the American Petroleum Institute and the Energy Information Administration. A build in stockpiles might reflect weaker demand conditions or elevated supply levels, which might then spur a selloff for the commodity.
On the other hand, a small increase or a large draw in inventories might reflect poor consumption, which could keep traders wary of a potential recession or even weaker purchases of fuel and energy commodities.
Risk appetite would likely push risk assets around as well, so a pickup in risk-taking might spur demand for higher-yielding assets like crude oil. On the other hand, a return in risk-off flows could spur downside for commodities.