
Crude oil is still in correction mode, as price is moving sideways above the $80 per barrel mark. A pullback could draw more buyers around the Fibonacci retracement levels.
The 38.2% Fib is close by at $79.50 per barrel and the 100 SMA dynamic inflection point. The 50% Fib is at $78.62 per barrel, then the 61.8% level is at $77.76 per barrel near the rising trend line support and 200 SMA.

The 100 SMA is above the 200 SMA to confirm that the path of least resistance is to the upside or that support is more likely to hold than to break.
Stochastic is also pulling higher after previously moving south, suggesting that buyers might be eager to return. RSI appears to be bottoming out, although it could simply be moving sideways as price is consolidating.
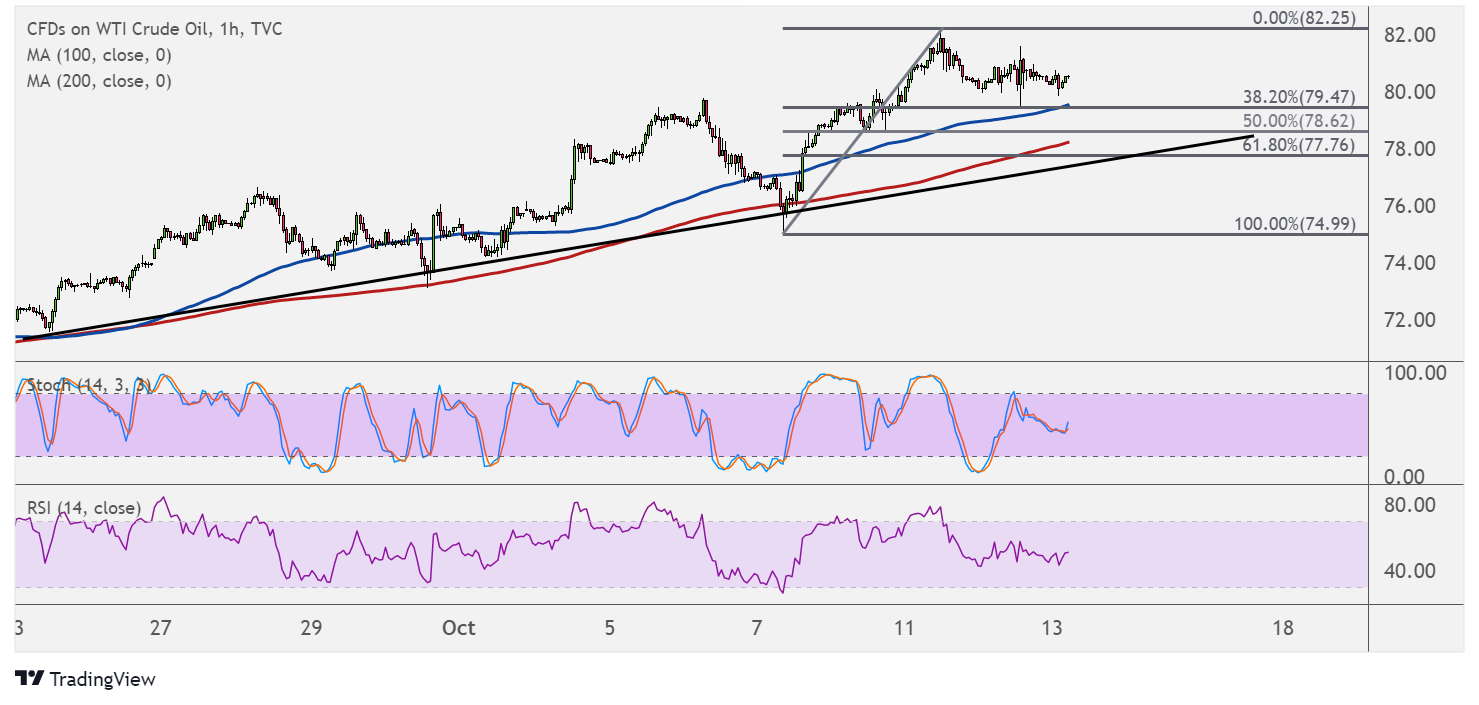
If any of the support levels hold, crude oil could recover to the swing high at $82.25 per barrel or higher. A break below the Fibs, on the other hand, could set off a reversal from the climb.
Crude oil remains supported on account of the energy crunch in several parts of the globe, particularly in Europe and Asia. Demand continues to pick up, as more businesses resume normal operations and consumers increase spending activity.
However, supply is constrained by weather disturbances like flooding in China or tropical storms in the US. This could yield another draw in stockpiles, which might drive prices even higher.
The EIA reported larger than expected gains in inventory levels over the past couple of weeks, but a draw this time might confirm that demand is rising while supply remains limited.
Also note that the OPEC refrained from increasing production levels despite strong pressure to do so, choosing to maintain their agreement to boost output by 400K barrels per day until December.