
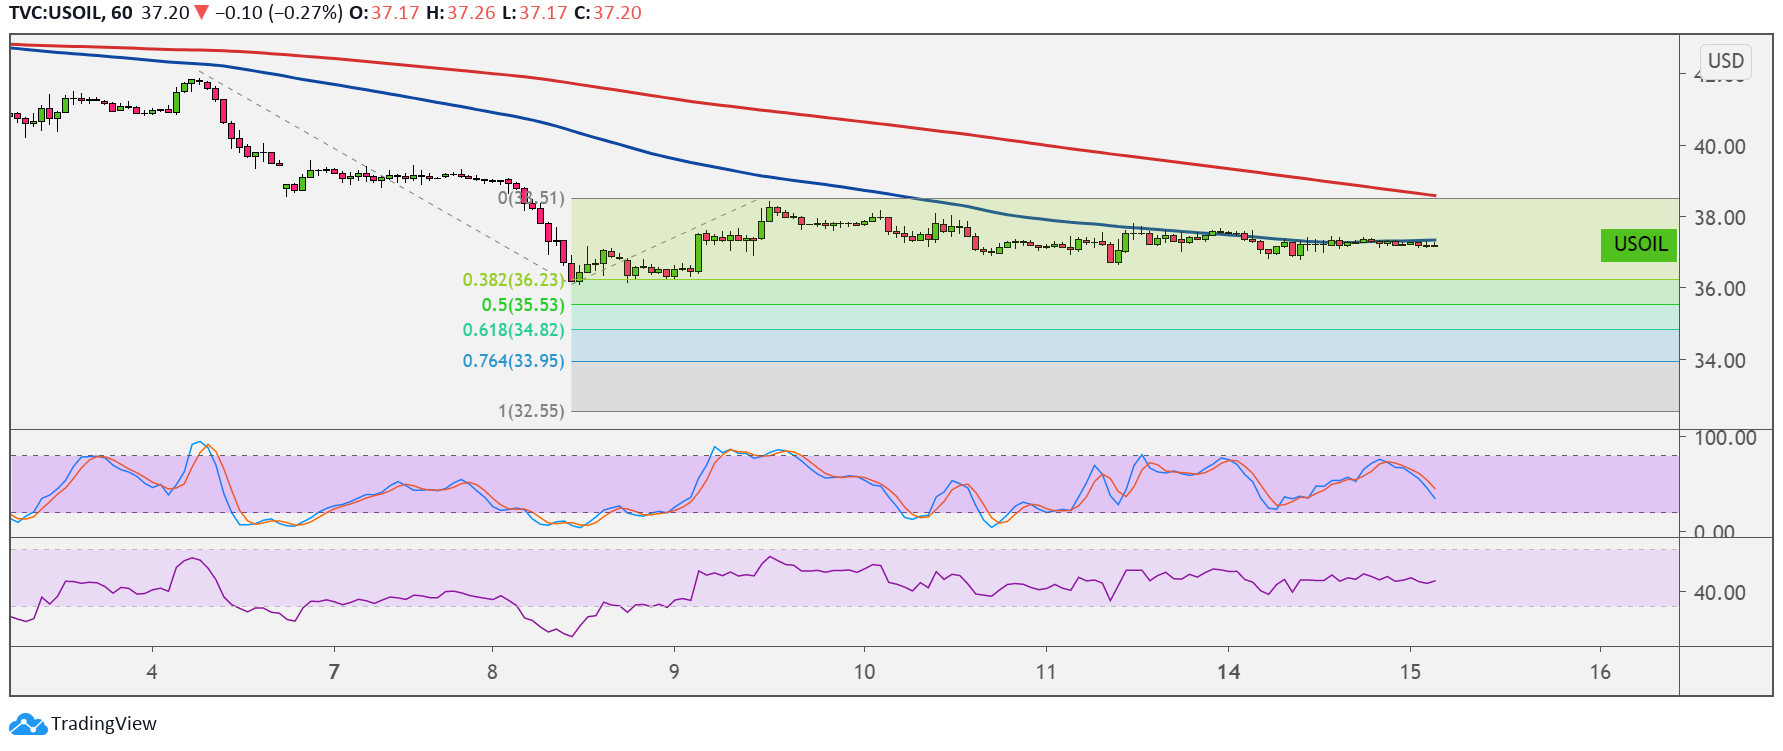
WTI crude oil is in the middle of consolidation inside a symmetrical triangle on the 1-hour chart, and price could be due for a breakout soon as it approaches the peak of the formation.
A break lower could set off a drop to the next downside targets marked by the Fibonacci extension tool. The 38.2% level is at $36.23 per barrel and lines up with the swing low, which could be the first major support zone.

Stronger selling pressure could take crude oil down to the 50% extension at $35.53 per barrel. The 61.8% level is at $34.82 per barrel then the 76.4% level is at $33.95 per barrel. The full extension is located at $32.55 per barrel.
The 100 SMA is below the 200 SMA to indicate that the path of least resistance is to the downside or that the selloff is likely to gain traction. The short-term moving average is holding as dynamic resistance at the moment, but a larger pullback could still find sellers at the 200 SMA dynamic inflection point.
Stochastic is heading lower to confirm that selling pressure is in play, and the oscillator has room to move lower before reflecting oversold conditions. This suggests that bears could have the upper hand for a bit longer. RSI is treading sideways to reflect consolidation.
WTI crude oil appears to be holding out for more market updates before deciding on a direction. Traders might be waiting for more clues from the FOMC decision, as optimism could bring in stronger demand for fuel as businesses look ahead to stronger performance. Dovish remarks, on the other hand, could usher in risk-off flows.
The upcoming inventory data from the API and EIA could also determine short-term direction, and allow a breakout from the triangle consolidation pattern. Note that the OPEC cut its forecast for Asia and global demand, which could mean stronger downside pressure.