
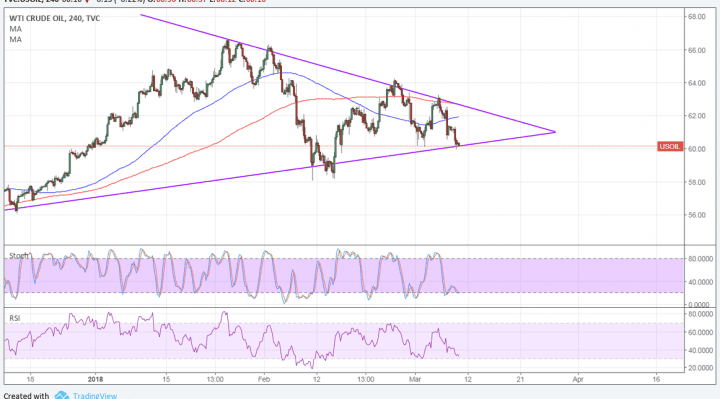
WTI crude oil is currently consolidating inside a symmetrical triangle formation and is testing support. A bounce could take it up to the triangle resistance around $62 per barrel while a break below $60 per barrel could set off a steep drop.
Note that crude oil has also formed a head and shoulders chart pattern to signal a potential downtrend. The 100 SMA is below the longer-term 200 SMA to show that the path of least resistance is to the downside. This means that support is more likely to break than to hold. A bounce to the triangle resistance could still encounter a ceiling at the 200 SMA dynamic inflection point.

Stochastic is already indicating oversold conditions and looks ready to turn higher to reflect a return in bullish momentum. RSI is on the move down, though, so there might still be some sellers left. The neckline of the reversal chart pattern is close to the triangle support, which means that it’s a key area to watch.
Trump’s announcement on providing exemptions for Canada and Mexico for higher tariffs while NAFTA negotiations are going on seems to have provided some temporary relief for commodities. Oil also drew some support from a smaller than expected build of 2.4 million barrels as reported by the EIA versus the consensus of 2.6 million barrels.
The attention turns to the Baker Hughes oil rig counts report next as another increase would once again ramp up oversupply fears. Apart from that, market sentiment could be influenced by today’s NFP release as a stronger than expected read would spur tightening expectations. In these cases, commodities usually tumble on expectations of slower business and consumer activity with higher borrowing costs.
On the other hand, a lower than expected read could calm concerns about global tightening. Analysts are expecting a 205K increase in hiring for February, slightly higher than the 200K gain recorded last January.