
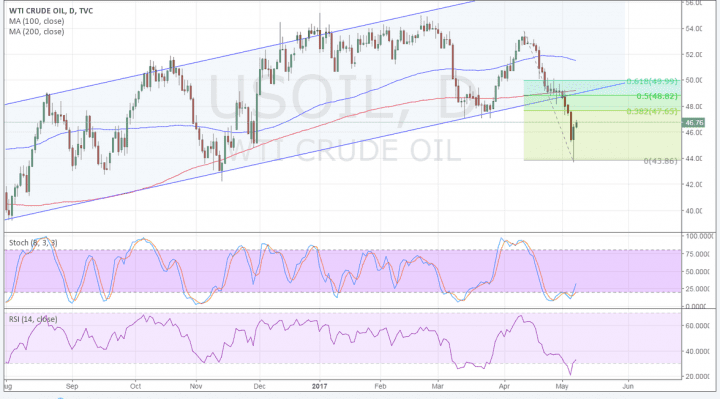
WTI crude oil recently broke below the rising channel support visible on its daily time frame. Price has dipped to the $44/barrel area before showing signs of a pullback.
Applying the Fibonacci retracement tool on the latest swing high and low shows that the 50% level lines up with the broken support around the $49 mark. A shallow pullback could already find resistance at the 38.2% Fib at $47.65 before resuming the drop.

The 100 SMA is still above the longer-term 200 SMA on this time frame and has a ways to go before making a downward crossover to reflect a surge in selling pressure. Also, stochastic is indicating oversold conditions so buyers may be ready to get back in the game. A bit of bullish divergence could be seen as stochastic made higher lows while price had lower lows. RSI is also turning higher so WTI crude oil might follow suit.
Still, this might just mark a much-needed profit-taking after that sharp drop last week. This was caused by several factors such as signs of weakening demand in China, risk aversion, hesitation among the OPEC to extend its output deal, and indications that production could pick up in Libya on potential peace talks.
WTI crude oil shrugged off the declines in US crude oil stockpiles as reported by the Energy Information Administration and American Petroleum Institute. If these reductions are not sustained this week, crude oil could be due for another wave lower as oversupply concerns remain in play.
Note that price also seems to have formed a head and shoulders pattern and may have already broken below the neckline around $49-50. In any case, a rally past the $50 mark could be enough to draw buyers back in the game and allow crude oil to resume trading inside the rising channel. This could put it back on track towards testing the resistance, but this could mostly hinge on the outcome of the OPEC meeting later this month.