
WTI crude oil is still in the middle of a correction but the presence of green candles suggests that bulls are returning. Price is stalling near the bottom of its ascending channel on the 1-hour time frame and might be due for a climb back to the top.
Applying the Fibonacci extension tool on this pullback shows that the 76.4% level lines up with the channel resistance around $54 per barrel while the 61.8% extension is at the swing high of $53 per barrel. Stronger bullish pressure could lead to an upside break of resistance until the full extension at $55.58 per barrel.

However, the 100 SMA is below the longer-term 200 SMA on this chart so the path of least resistance might still be to the downside. The 200 SMA is holding as dynamic support, though, and a deeper pullback could find a floor at the 100 SMA dynamic inflection point just below the channel support at $48.50 per barrel.
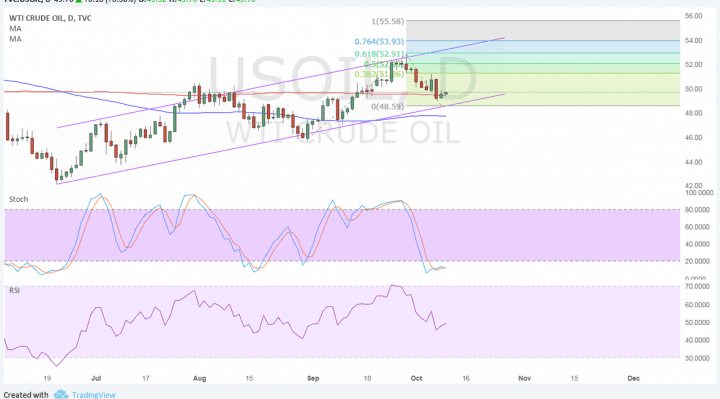
Stochastic is already indicating oversold conditions, which means that sellers need to take a break and might let buyers take over. RSI has more room to drop, though, so bearish pressure could stay in play for a bit longer until this oscillator hits oversold levels and turns back up.
OPEC leaders appear more amenable to an extension of the output deal past the March 2018 end-date in an effort to keep markets rebalanced. Secretary General Barkindo even hinted that other non-member nations might join in and that some members might need to take additional measures. He also assured that the increases in demand forecasts for this year and the next would likely be the trend. Saudi Arabia also noted that it could look into capping exports as well.
Looking ahead, crude oil could take its cue from inventory data by the American Petroleum Institute and the Energy Information Administration. Declines have been recorded the other week so traders are eager to find out if this momentum was sustained.