
WTI crude oil has recently broken past the short-term inverse head and shoulders neckline. This signals that further gains are in the cards, perhaps after this quick pullback.
Applying the Fibonacci retracement tool on the latest swing high and low shows that the 50% level lines up with the rising trend line support and the broken neckline. It is also around the 100 SMA dynamic support.

Speaking of moving averages, the 100 SMA is above the longer-term 200 SMA so the path of least resistance is to the upside. In other words, the rally is more likely to continue than to reverse.
Stochastic appears to be turning higher without hitting oversold conditions, which signals that buyers are eager to hop back in. With that, the 38.2% Fib might be enough to keep losses in check around $51.50 per barrel. A larger correction could still find a floor at the 61.8% Fib or $51 per barrel.
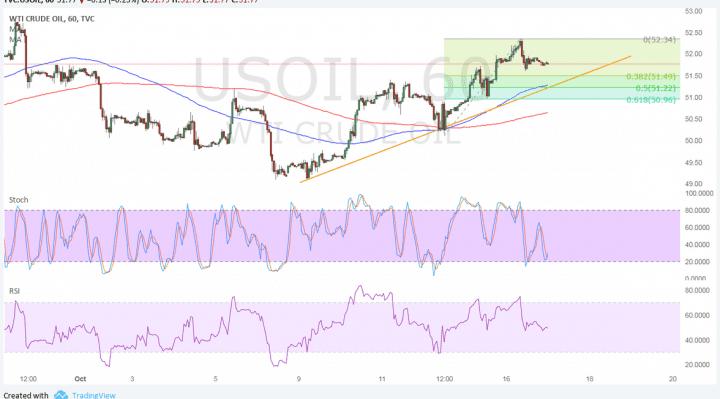
RSI, on the other hand, is turning lower to reflect the presence of bearish pressure. If this keeps up, a break below the trend line support could take crude oil to the 200 SMA dynamic support at $50.50 per barrel next.
Escalation of risks from Iran-Iraq could impact crude oil prices as sanctions are being imposed by the US. This could take some market attention away from inventory reports from the American Petroleum Institute and the Energy Information Administration this week, although another large build in stockpiles and exports could also dampen price gains. Rig count, however, has ticked lower.
Although several institutions projected higher global demand for crude oil next year, the IEA also recently projected that the commodity price could hit a ceiling by then. Still, the agency noted that the cooperation between Saudi Arabia and Russia spells positive prospects. Traders are also still waiting on the OPEC for an announcement of an output deal extension, and failing to do so could pull the rug from under crude oil.