
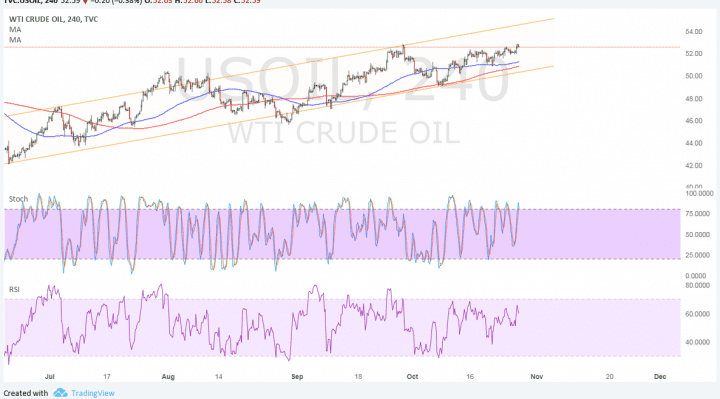
WTI crude oil is still hovering around the mid-channel area of interest of its ascending channel on the 4-hour chart. Price appears to be gaining enough bullish momentum for a continuation of the climb to the channel resistance at $54 per barrel.
The 100 SMA is still above the longer-term 200 SMA so the path of least resistance is to the upside. The moving averages appear to have attempted a downward crossover but this wasn’t completed.

Stochastic is pointing up to show that buyers are still in control but the oscillator is already nearing overbought conditions to signal a potential turnaround. RSI is also heading north so WTI crude oil might follow suit until the oscillator hits overbought levels and turns back down.
Inventory data showed conflicting reports for the previous week as the American Petroleum Institute reported a larger than expected draw while the Energy Information Administration printed a surprise build of 0.9 million barrels.
Furthermore, the report showed that refineries operated at 87.8% of their operable capacity. Gasoline production decreased to an average of over 9.9 million barrels per day while distillate fuel production increased, averaging 4.8 million barrels per day. U.S. crude oil imports averaged over 8.1 million barrels per day last week, up by 640,000 barrels per day from the previous week.
From a longer-term perspective, the expected OPEC output deal could still keep prices supported throughout 2018 while the ongoing conflict in Iran threatens to disrupt production. Apart from that, the IEA projected that global demand will tick higher next year, adding an extra factor propping the commodity up.
Looking ahead, the Baker Hughes oil rig count could be the next short-term catalyst for crude oil as an increase could revive oversupply fears while another reduction could keep those concerns in check. Overall market sentiment influenced by economic data and central bank biases are also likely to influence crude oil direction.